
Welcome to a deep dive into the City of Seattle’s Operating Budget.
Seattleites have a right to know if the policies they’ve supported are actually delivering on their promises. How can we determine if the policies Seattle has enacted are achieving their intended goals? The City’s budget, often presented as a straightforward financial document, is the first place to look for answers.
But a closer examination invites more questions. Do the City’s priorities align with voters’? Is the spending sustainable? Is the City transparent about where the money goes? Does it report on whether programs are having success?
This series of four posts provides an overview of the City of Seattle’s budget, addressing key questions:
- How big is the budget and how has it grown over time?
- Where does the money come from?
- Where does it go and what is it paying for?
- Is the budget sustainable?
The most important question of all is this: Is it working? Future posts will delve deeper into specific policy areas, analyzing not just the financial aspects but also the goals and measurable outcomes associated with them. What’s working? What isn’t?
Operating budget
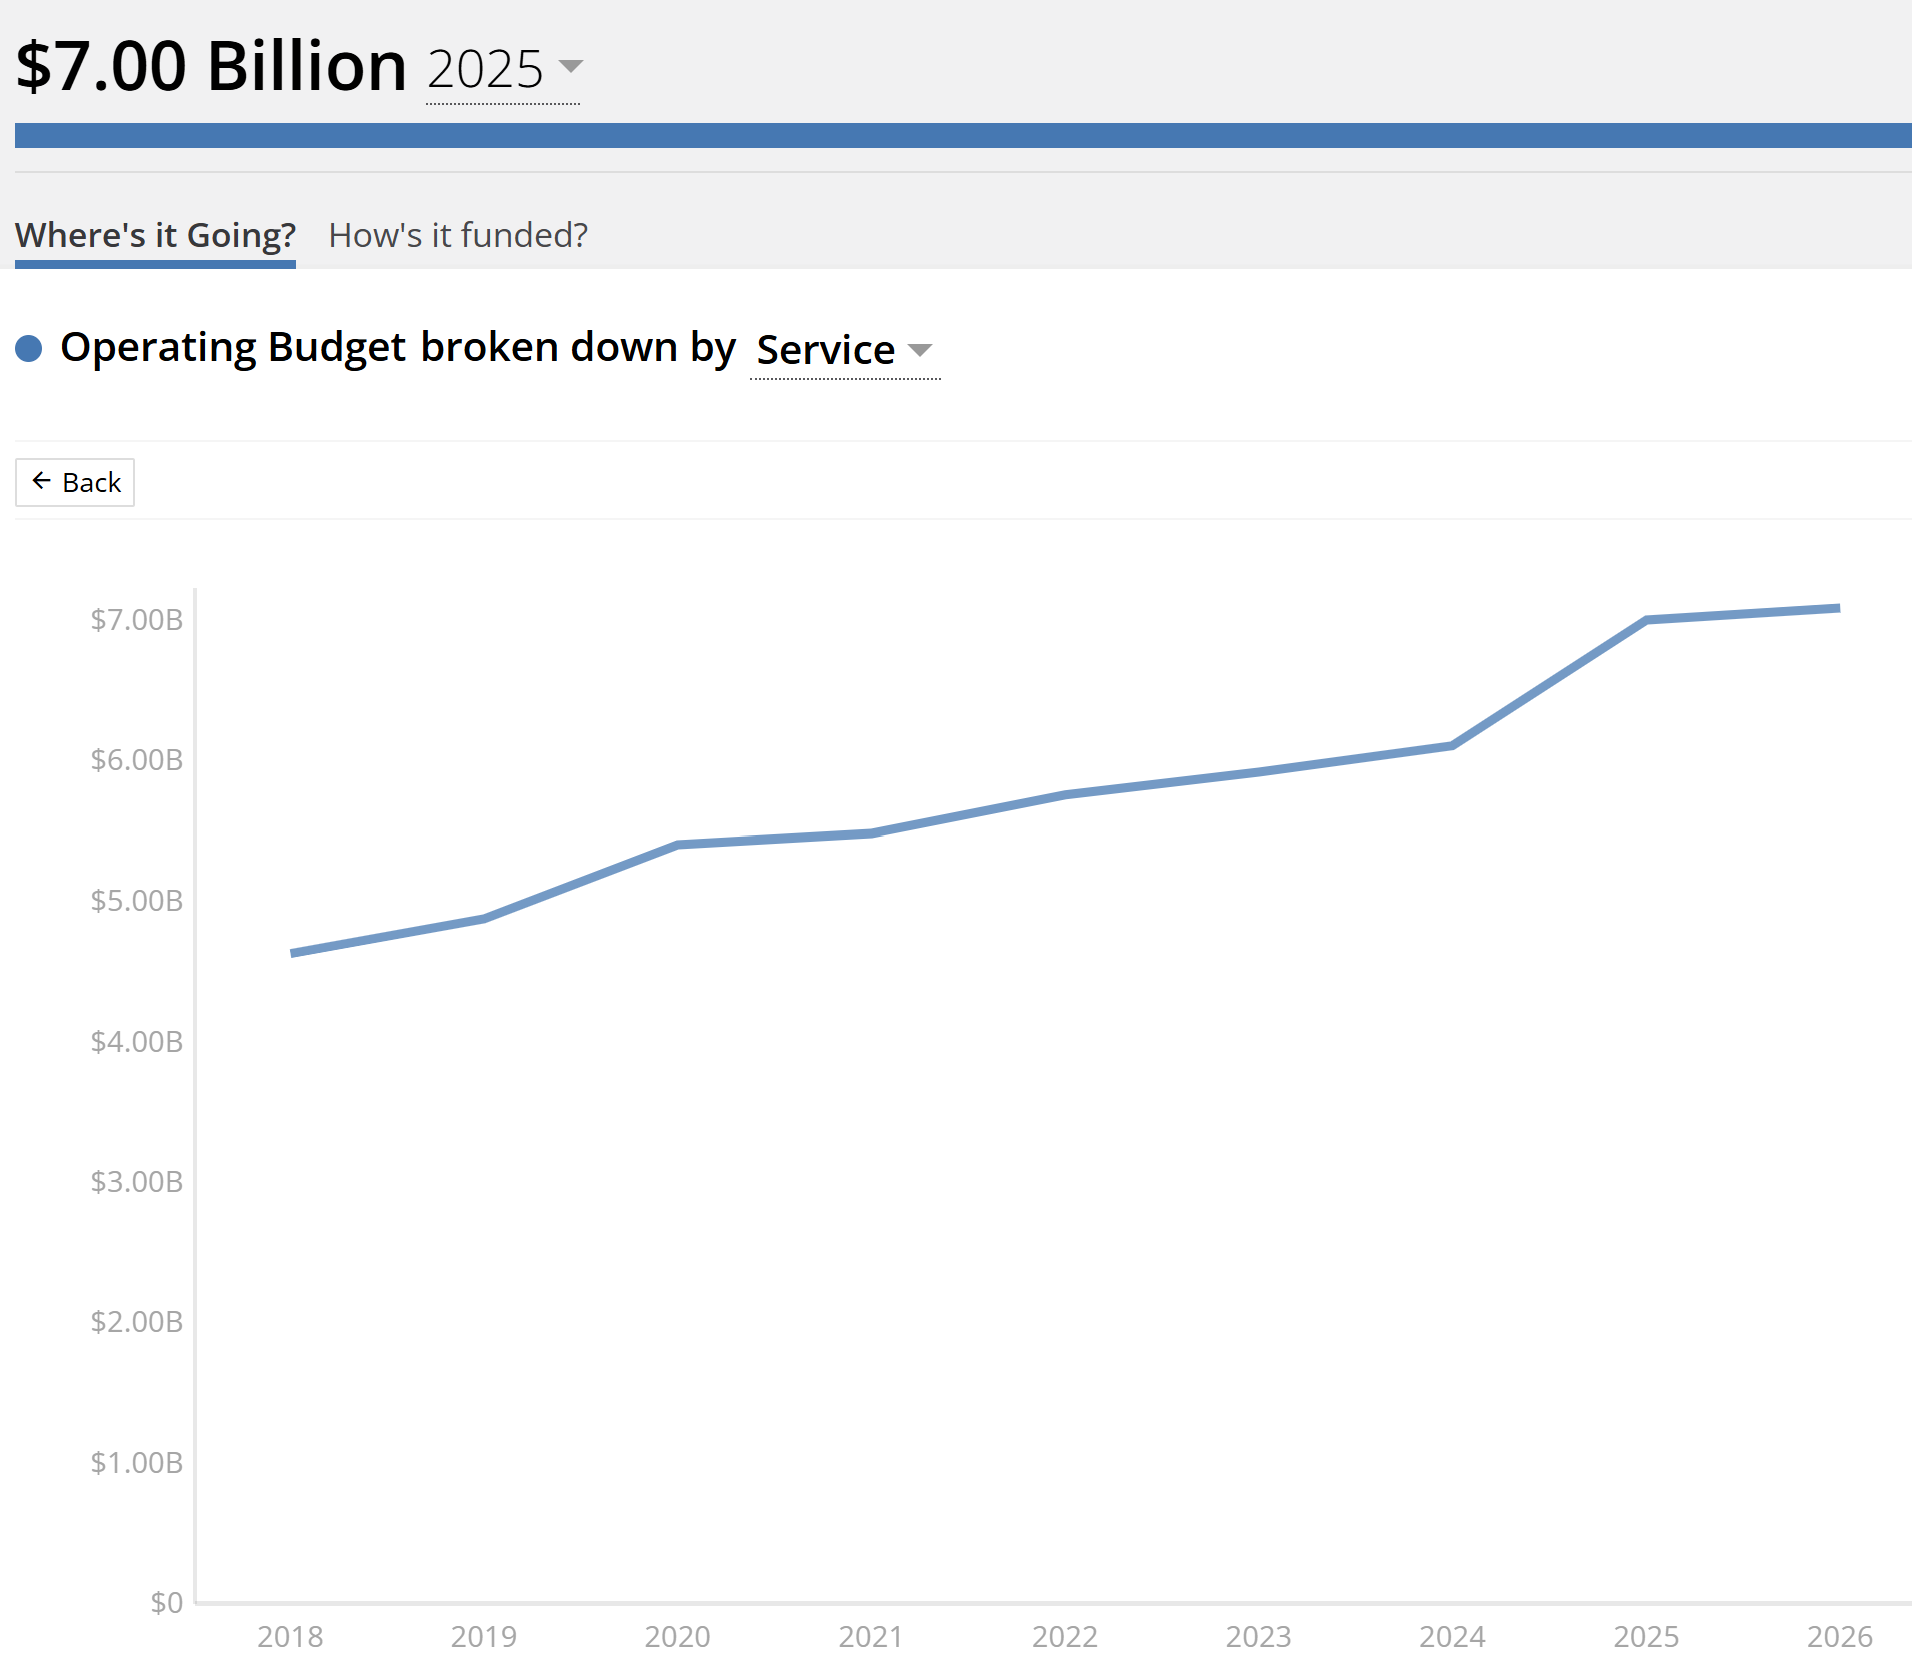
The City of Seattle’s 2025 operating budget is $7 billion. The City’s Open Budget portal provides historical data back to 2018. For example, the operating budget in 2025 is 51% greater than the $4.63 billion operating budget in 2018.
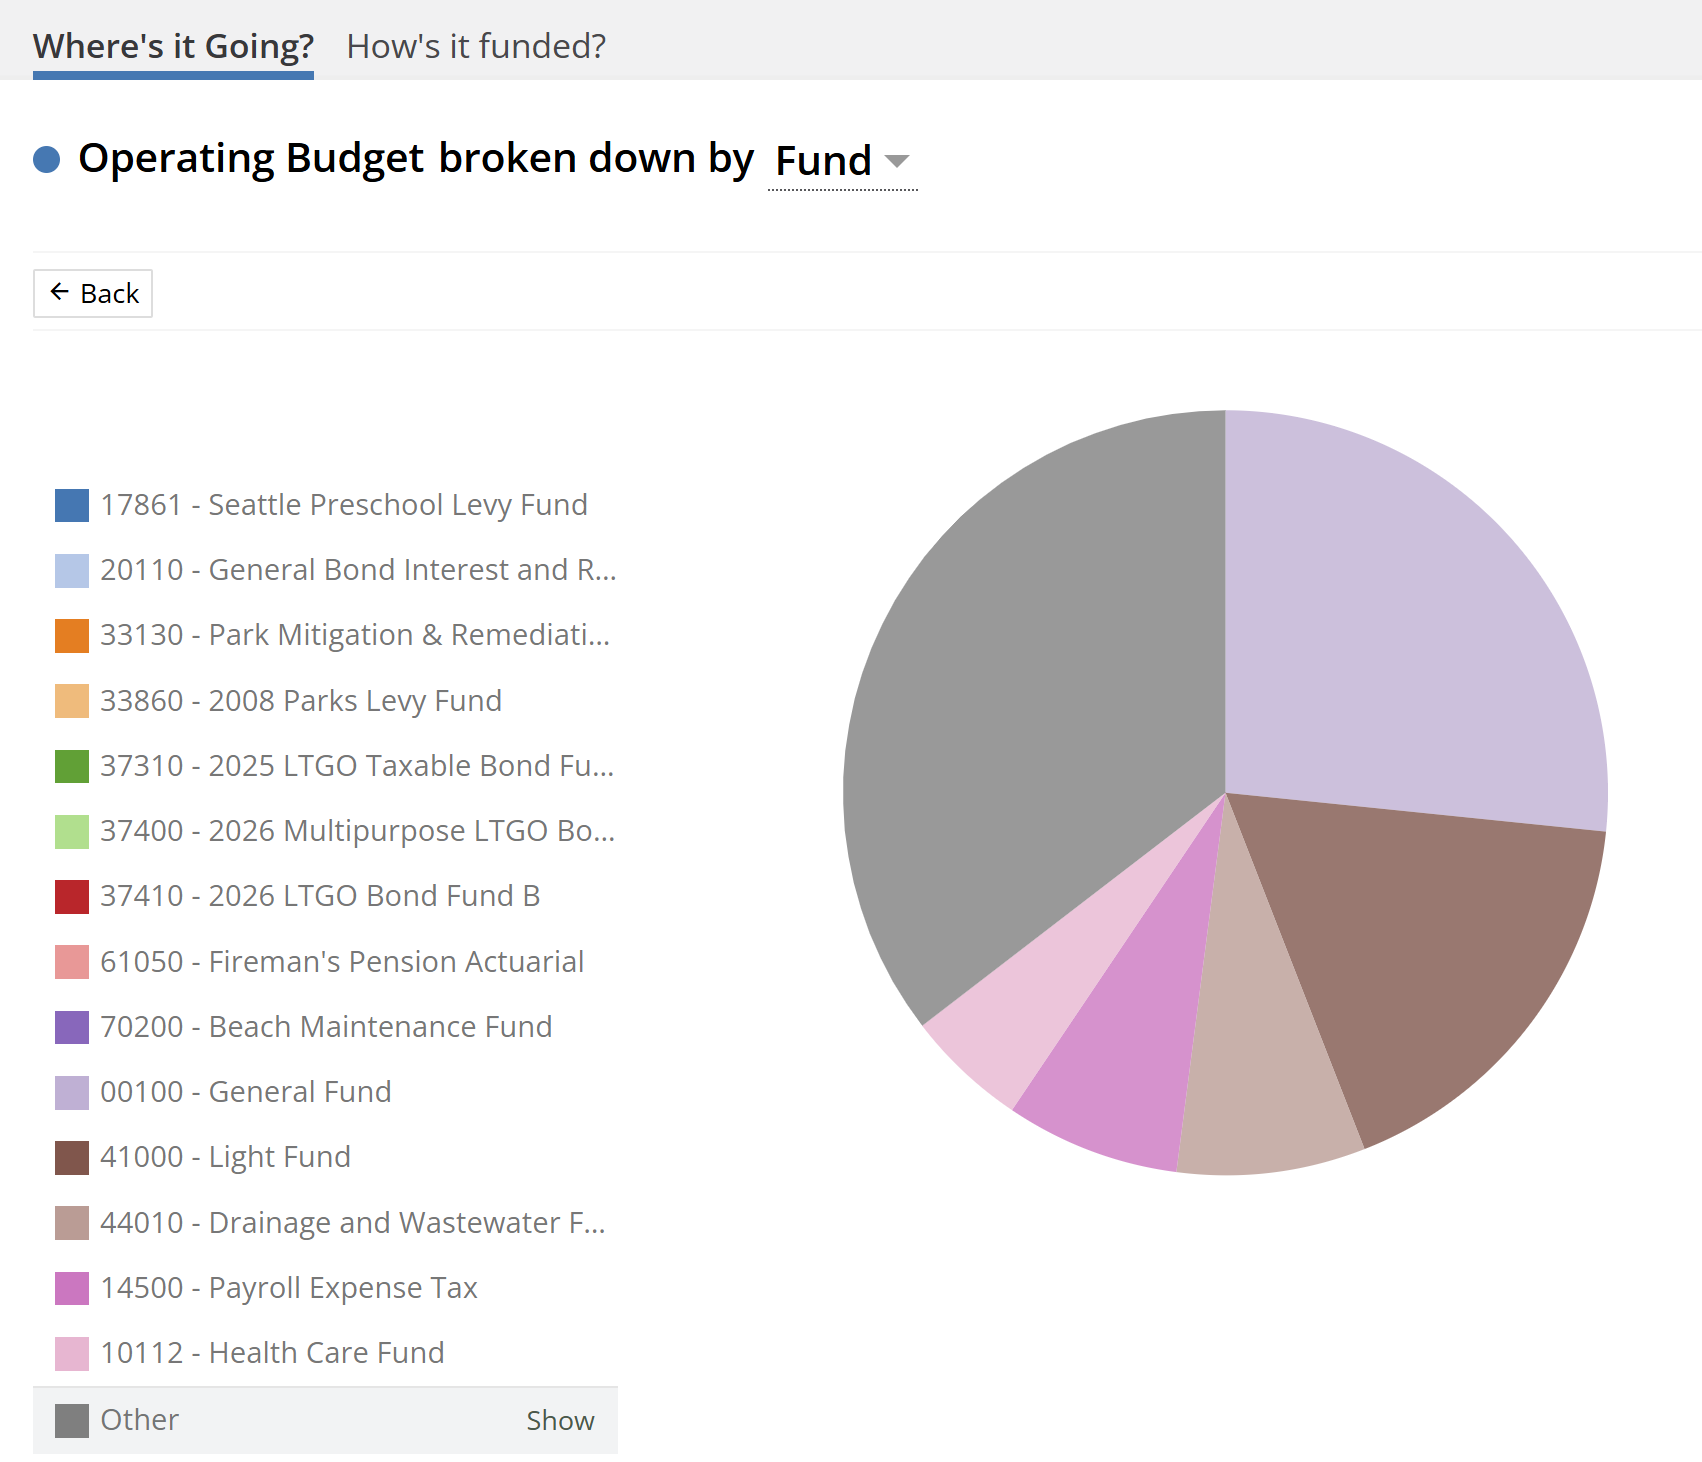
Open Budget organizes this data in several ways – by fund (cash coming in), by department (cash going out), and by program and service (what the cash is paying for).
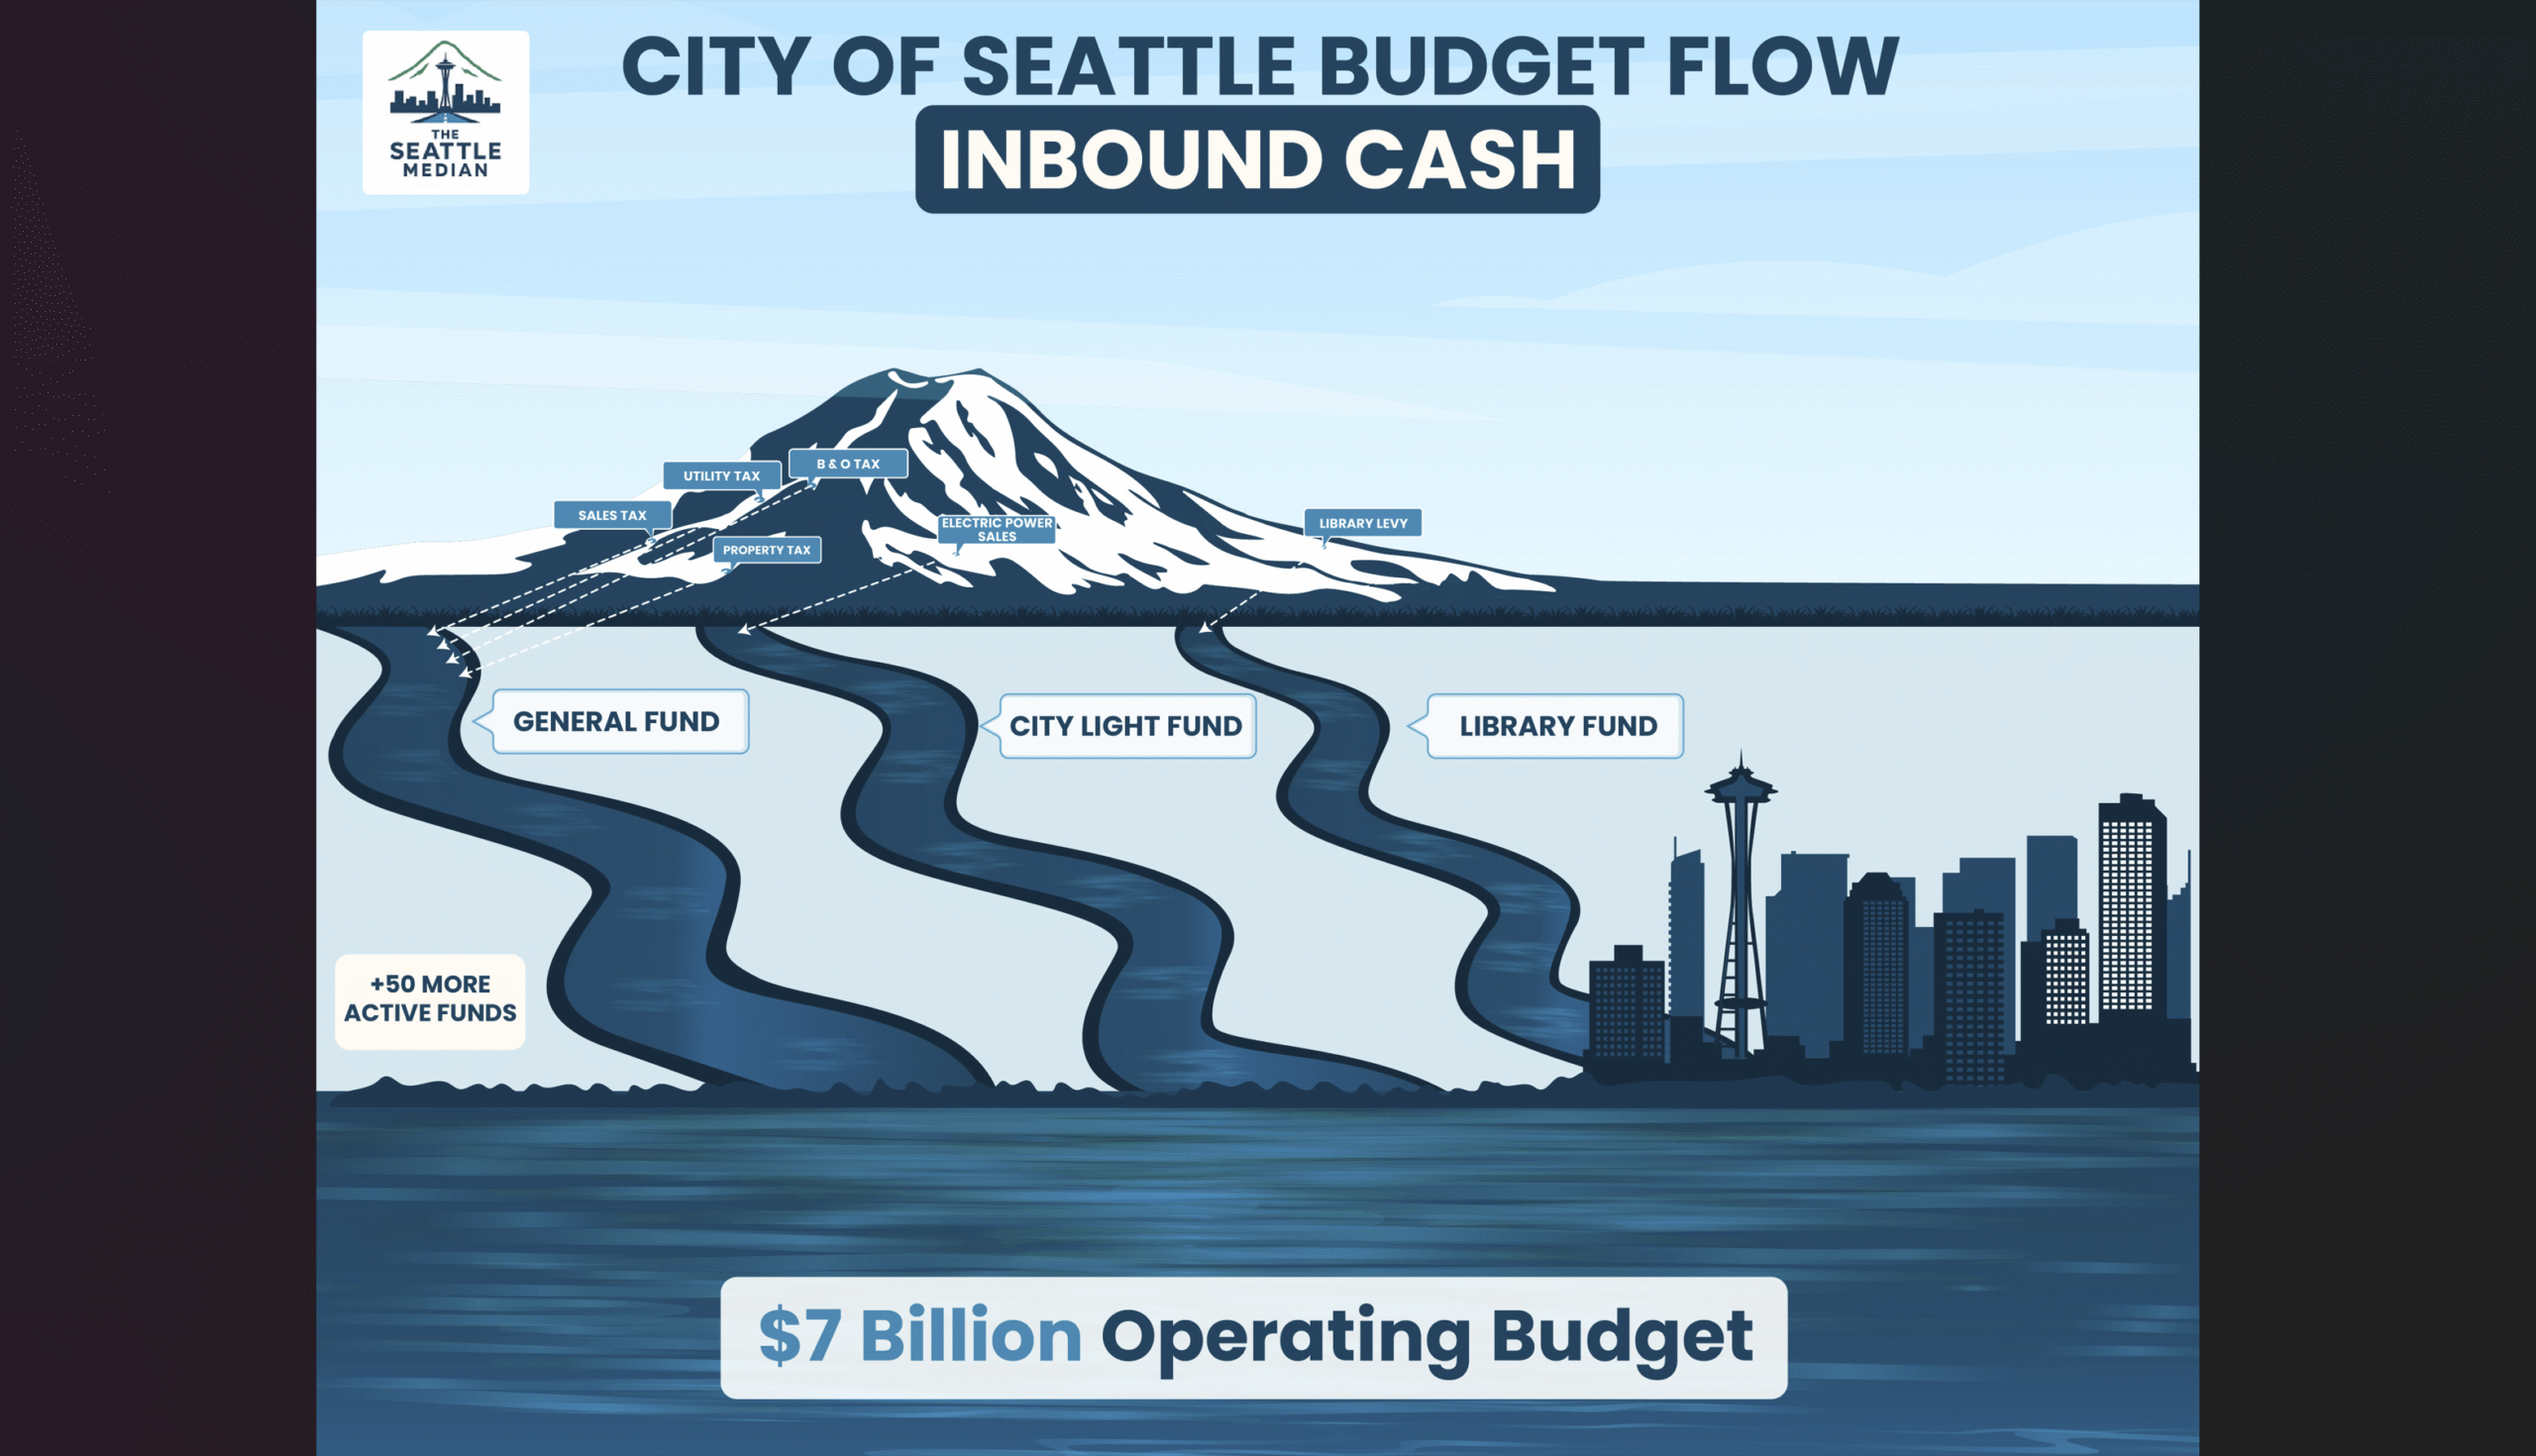
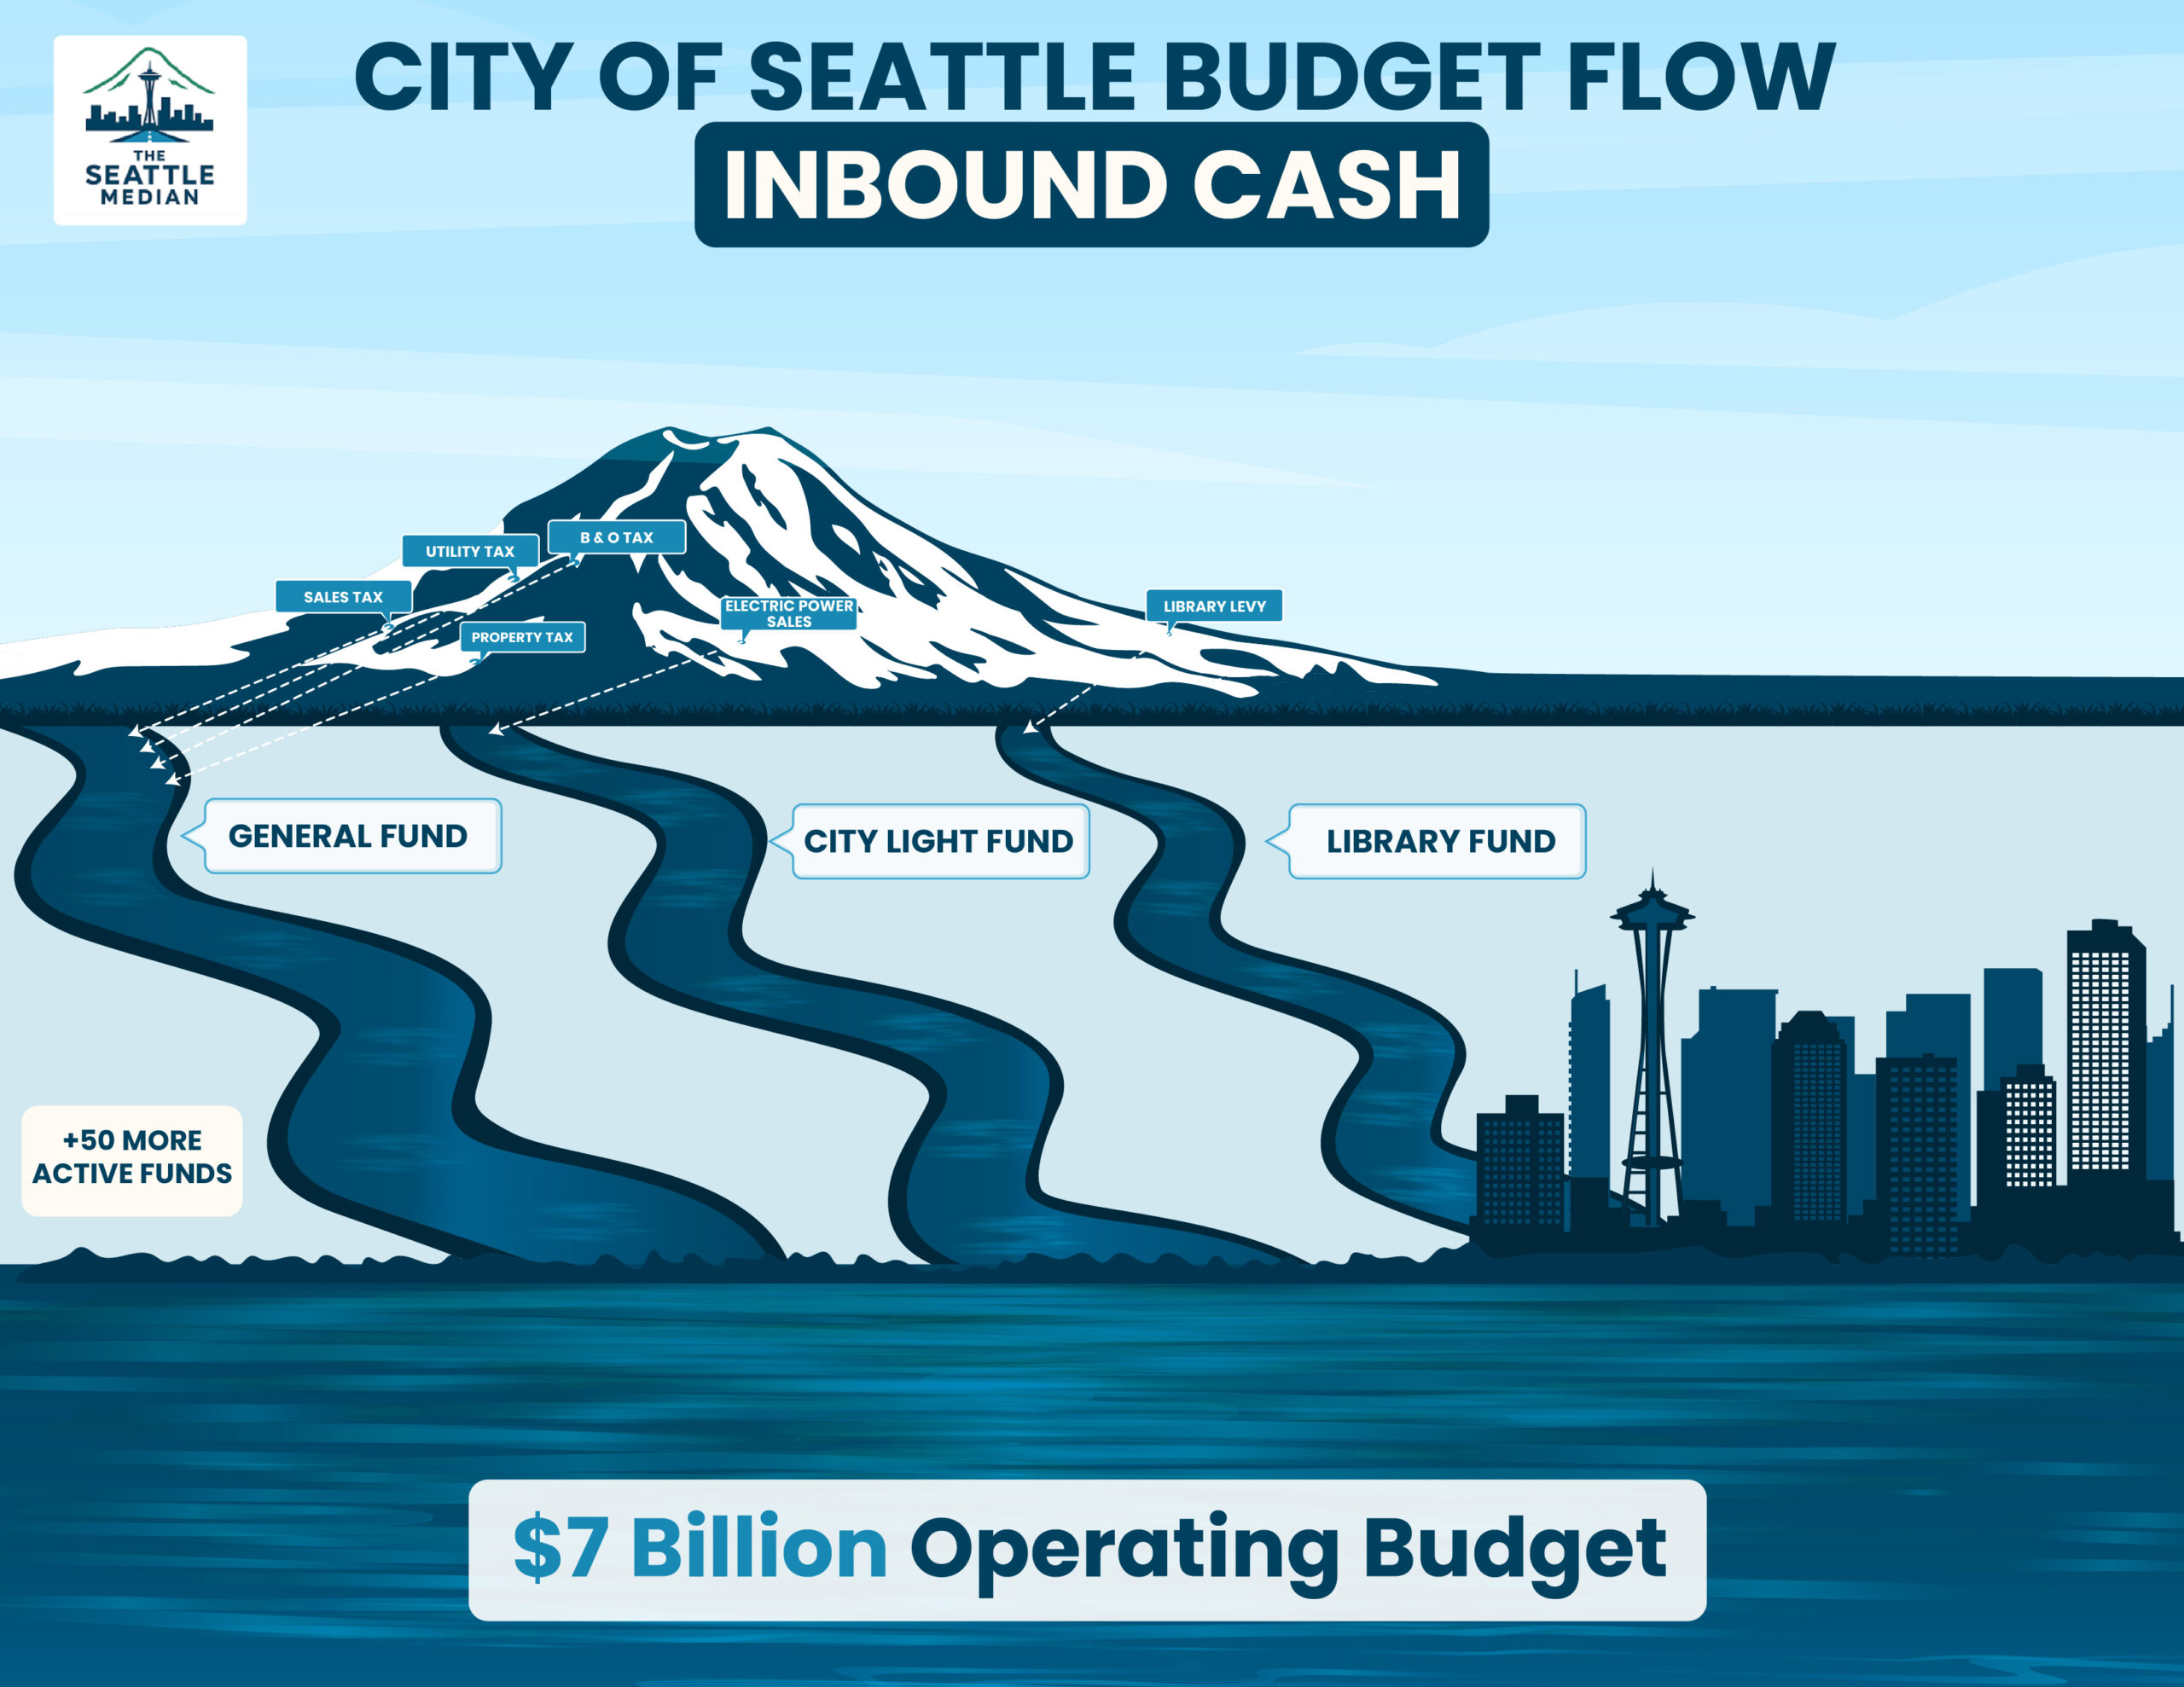
The Cash Coming In
Restricted Funds
There are 53 active funding sources for the 2025 operating budget that we (taxpayers, collectively) contribute to in a variety of ways. These include:
- User fees that show up on our utility bills, which fill the Light Fund, the Water Fund, the Solid Waste Fund, etc.
- Property tax levy lid lifts that we’ve approved, which fill specific funds for specific uses (i.e. the Families Education Preschool Promise Levy, the Library Fund, etc.)
- Municipal bonds
- State and federal grants.
These funds are restricted, meaning utility fees go to utilities, Library Fund revenues go to libraries, etc.
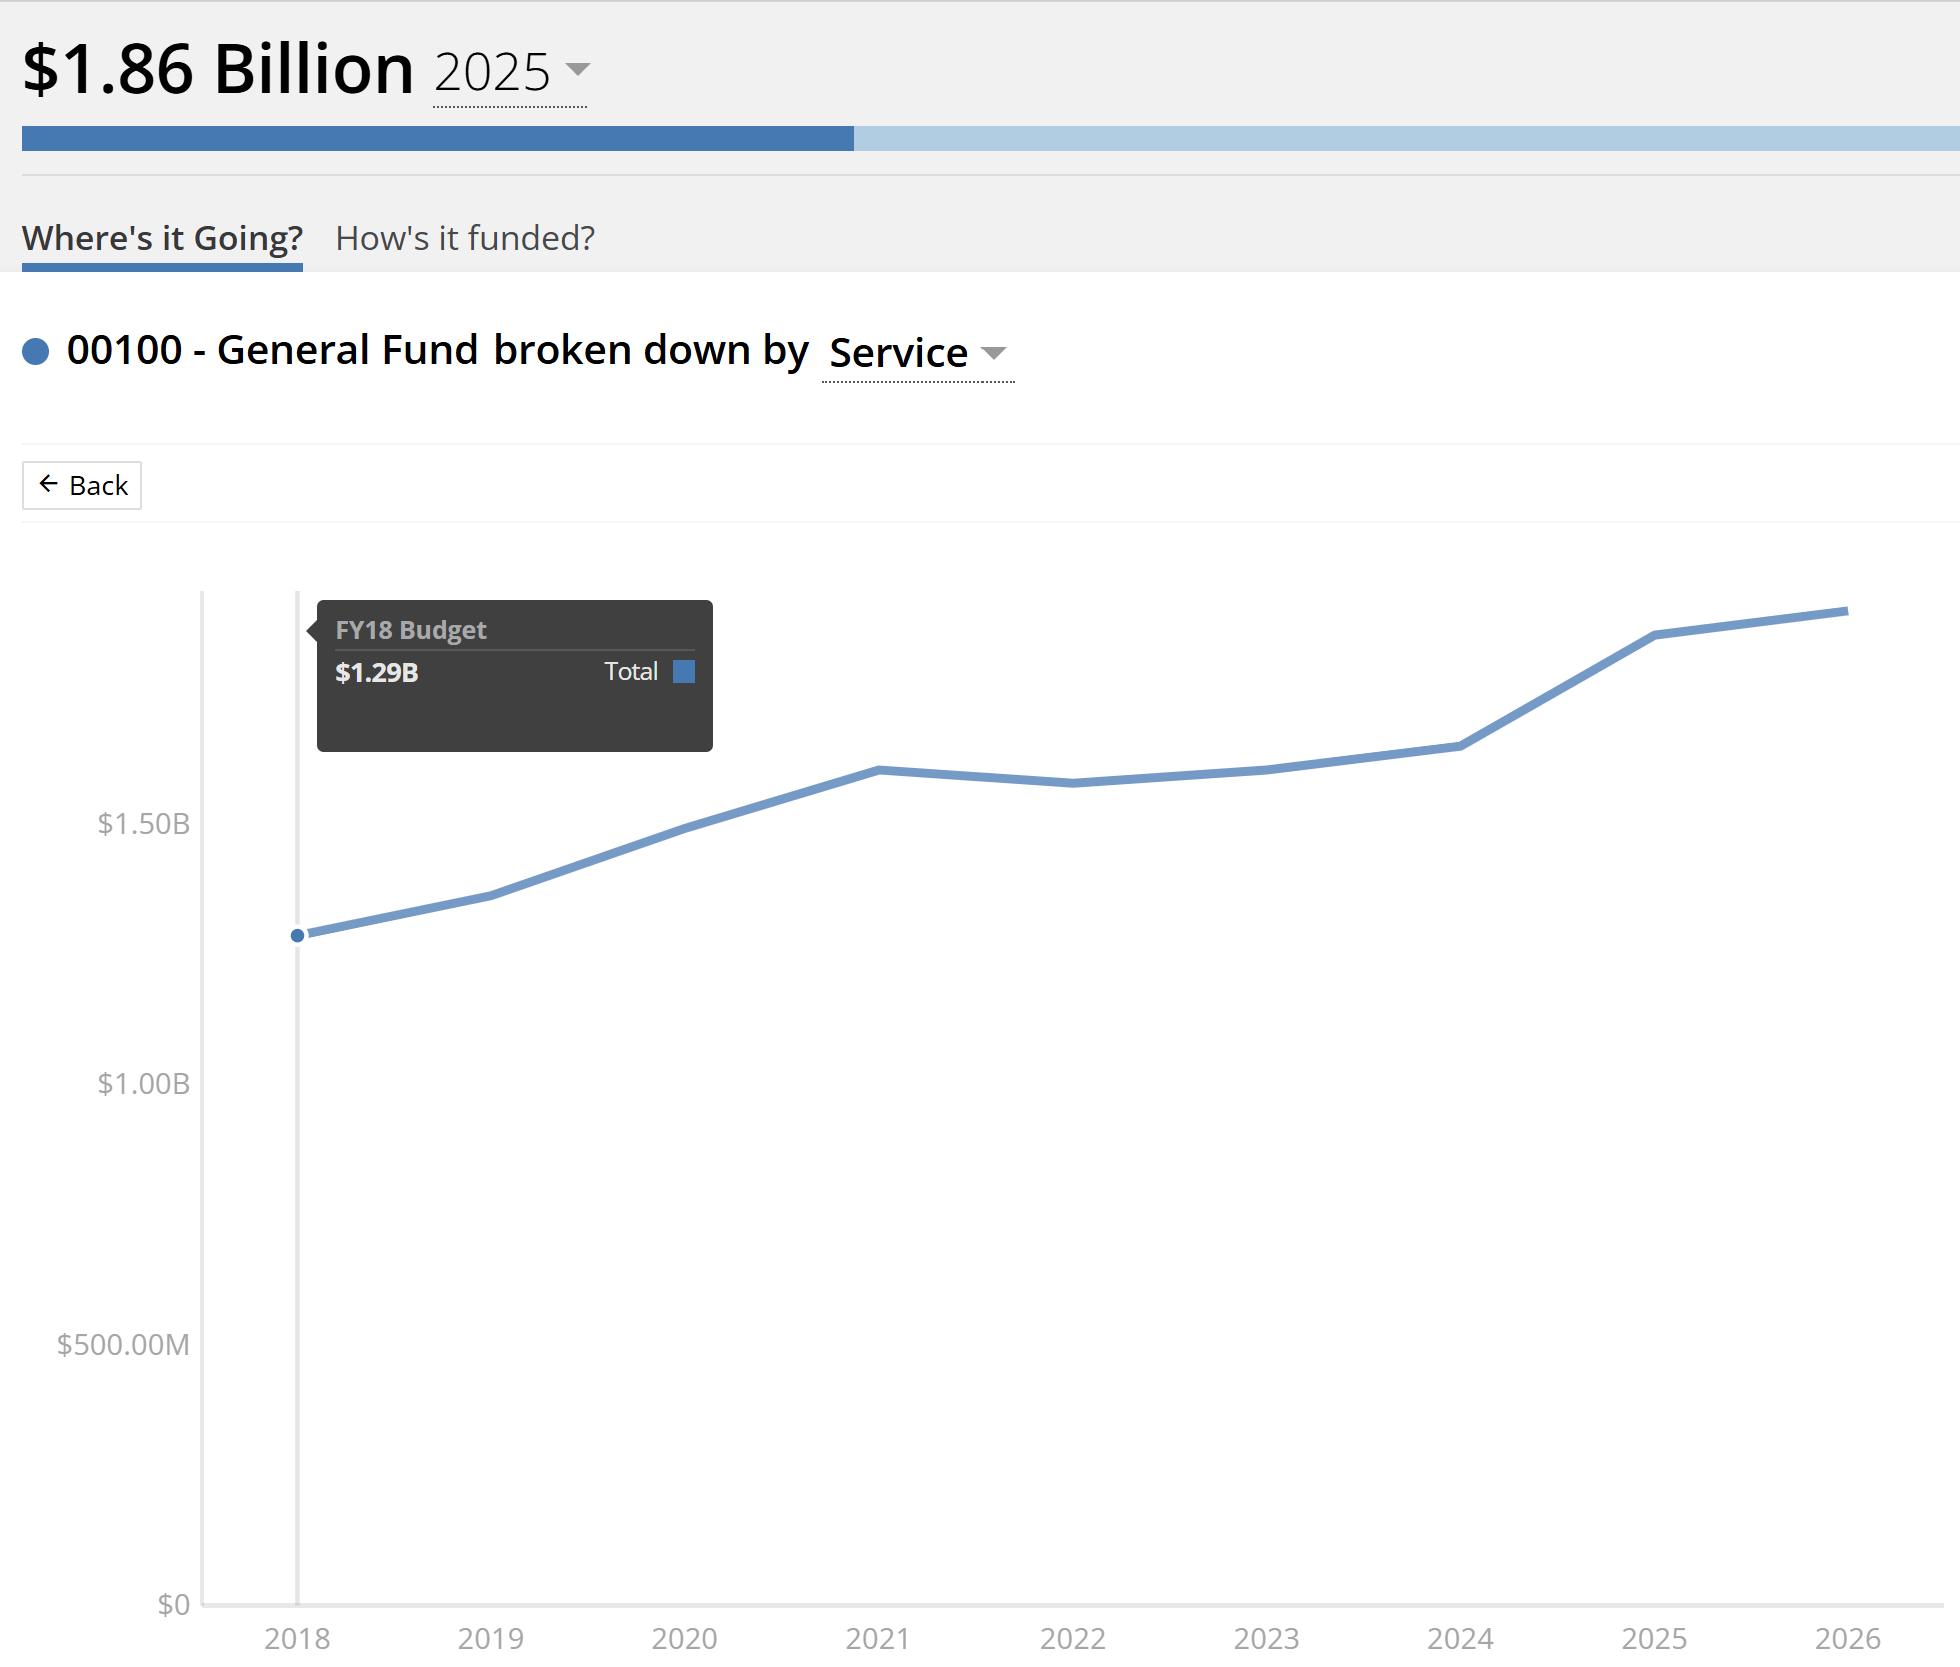
The primary exception is the General Fund, which you can see above is the largest of all funds at $1.86 billion, or 26.6% of the operating budget. The General Fund can also be tracked back to 2018, when it stood at $1.29 billion.
The General Fund
The General Fund is the one we most often hear debated at City Hall because it’s unrestricted. That means its revenues are flexible and can be redirected by our elected officials.
It’s also the fund where the cost of the programs it pays for have exceeded the revenue it receives since 2019 (more on this in a future post).
General Fund revenues are primarily fueled by property, retail sales, utility, and business & occupation (B&O) taxes, all paid by hardworking Seattle residents and businesses.
Payrolls Expense Tax Fund
Another exception is the Payroll Expense Tax Fund, which is funded by a tax on employees of large businesses, also known as the JumpStart Tax. This tax was enacted in 2020 as a dedicated funding source mostly for affordable housing, with other investments in tourism, equitable economic development, and the Green New Deal.
However, every year since it’s been enacted, because of the spending challenges in the General Fund references above, an increasing portion Payroll Expense Tax has been diverted into the General Fund to allow it to balance (more on this in a future post.)
Here’s a look at the basic flow of funds into the operating budget.
In the next post, we’ll look at how the Operating Budget allocates these dollars.