
In this post, we look at how the Operating Budget is spent.
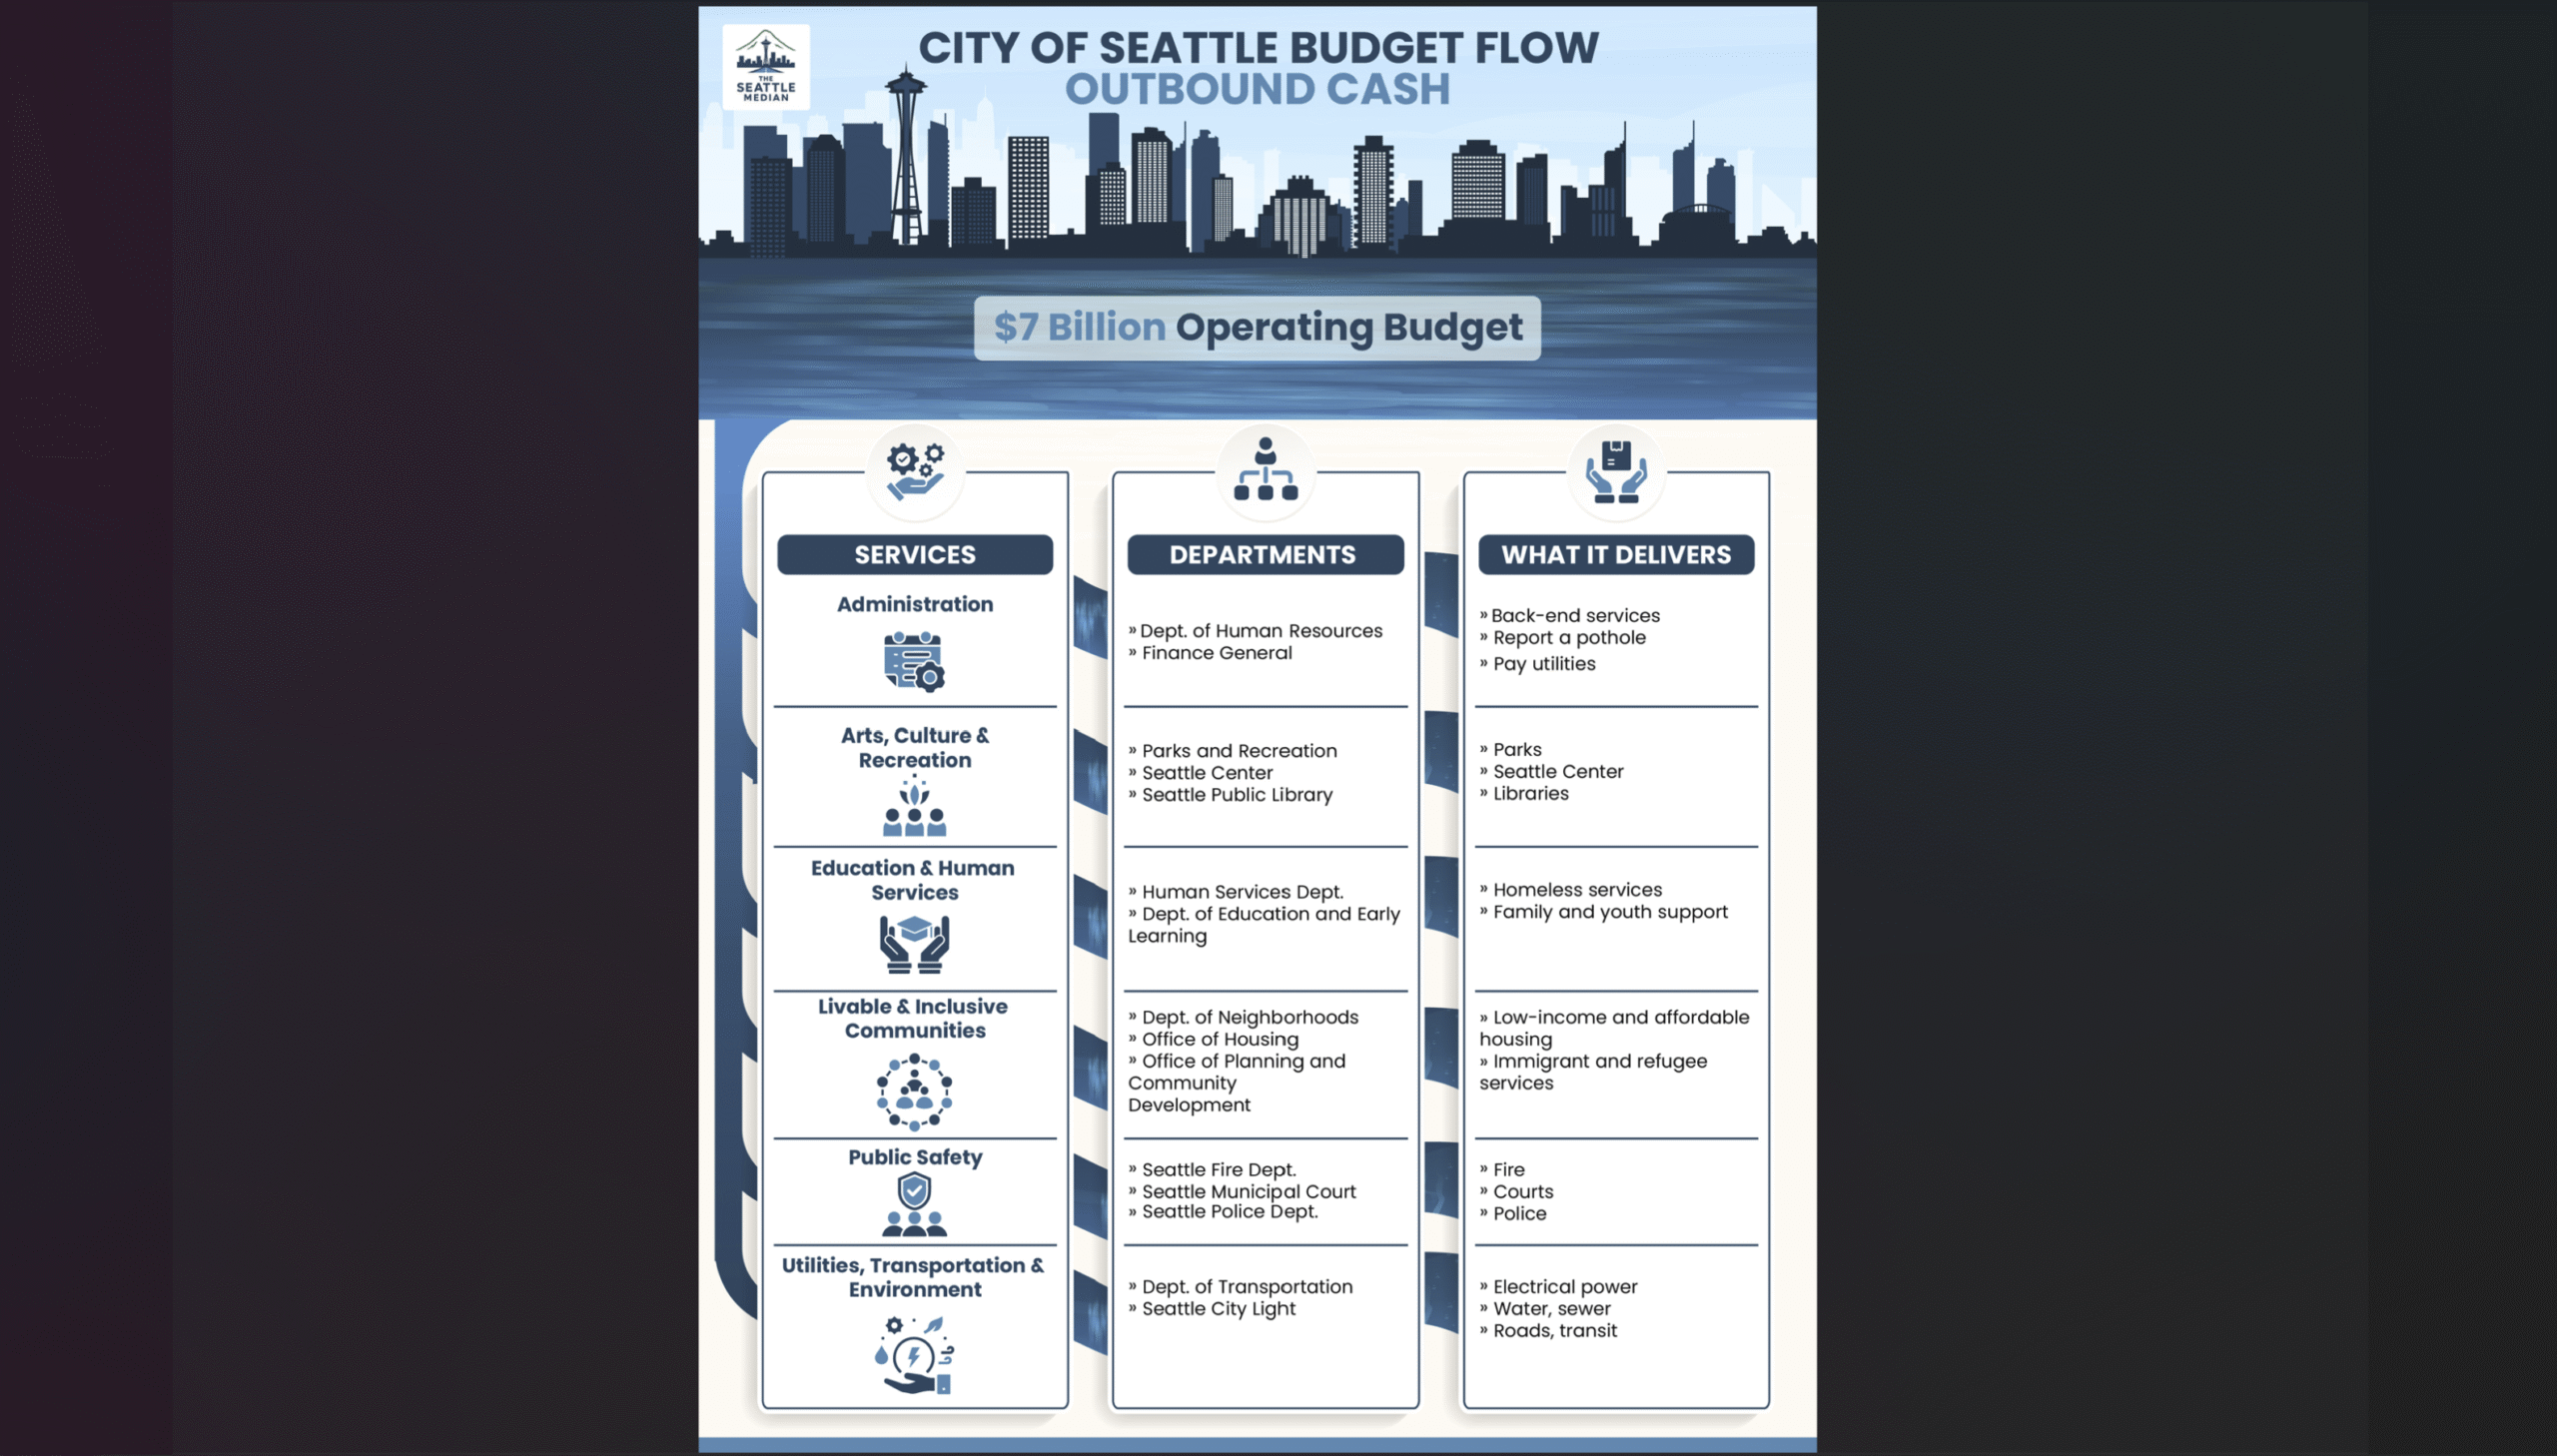
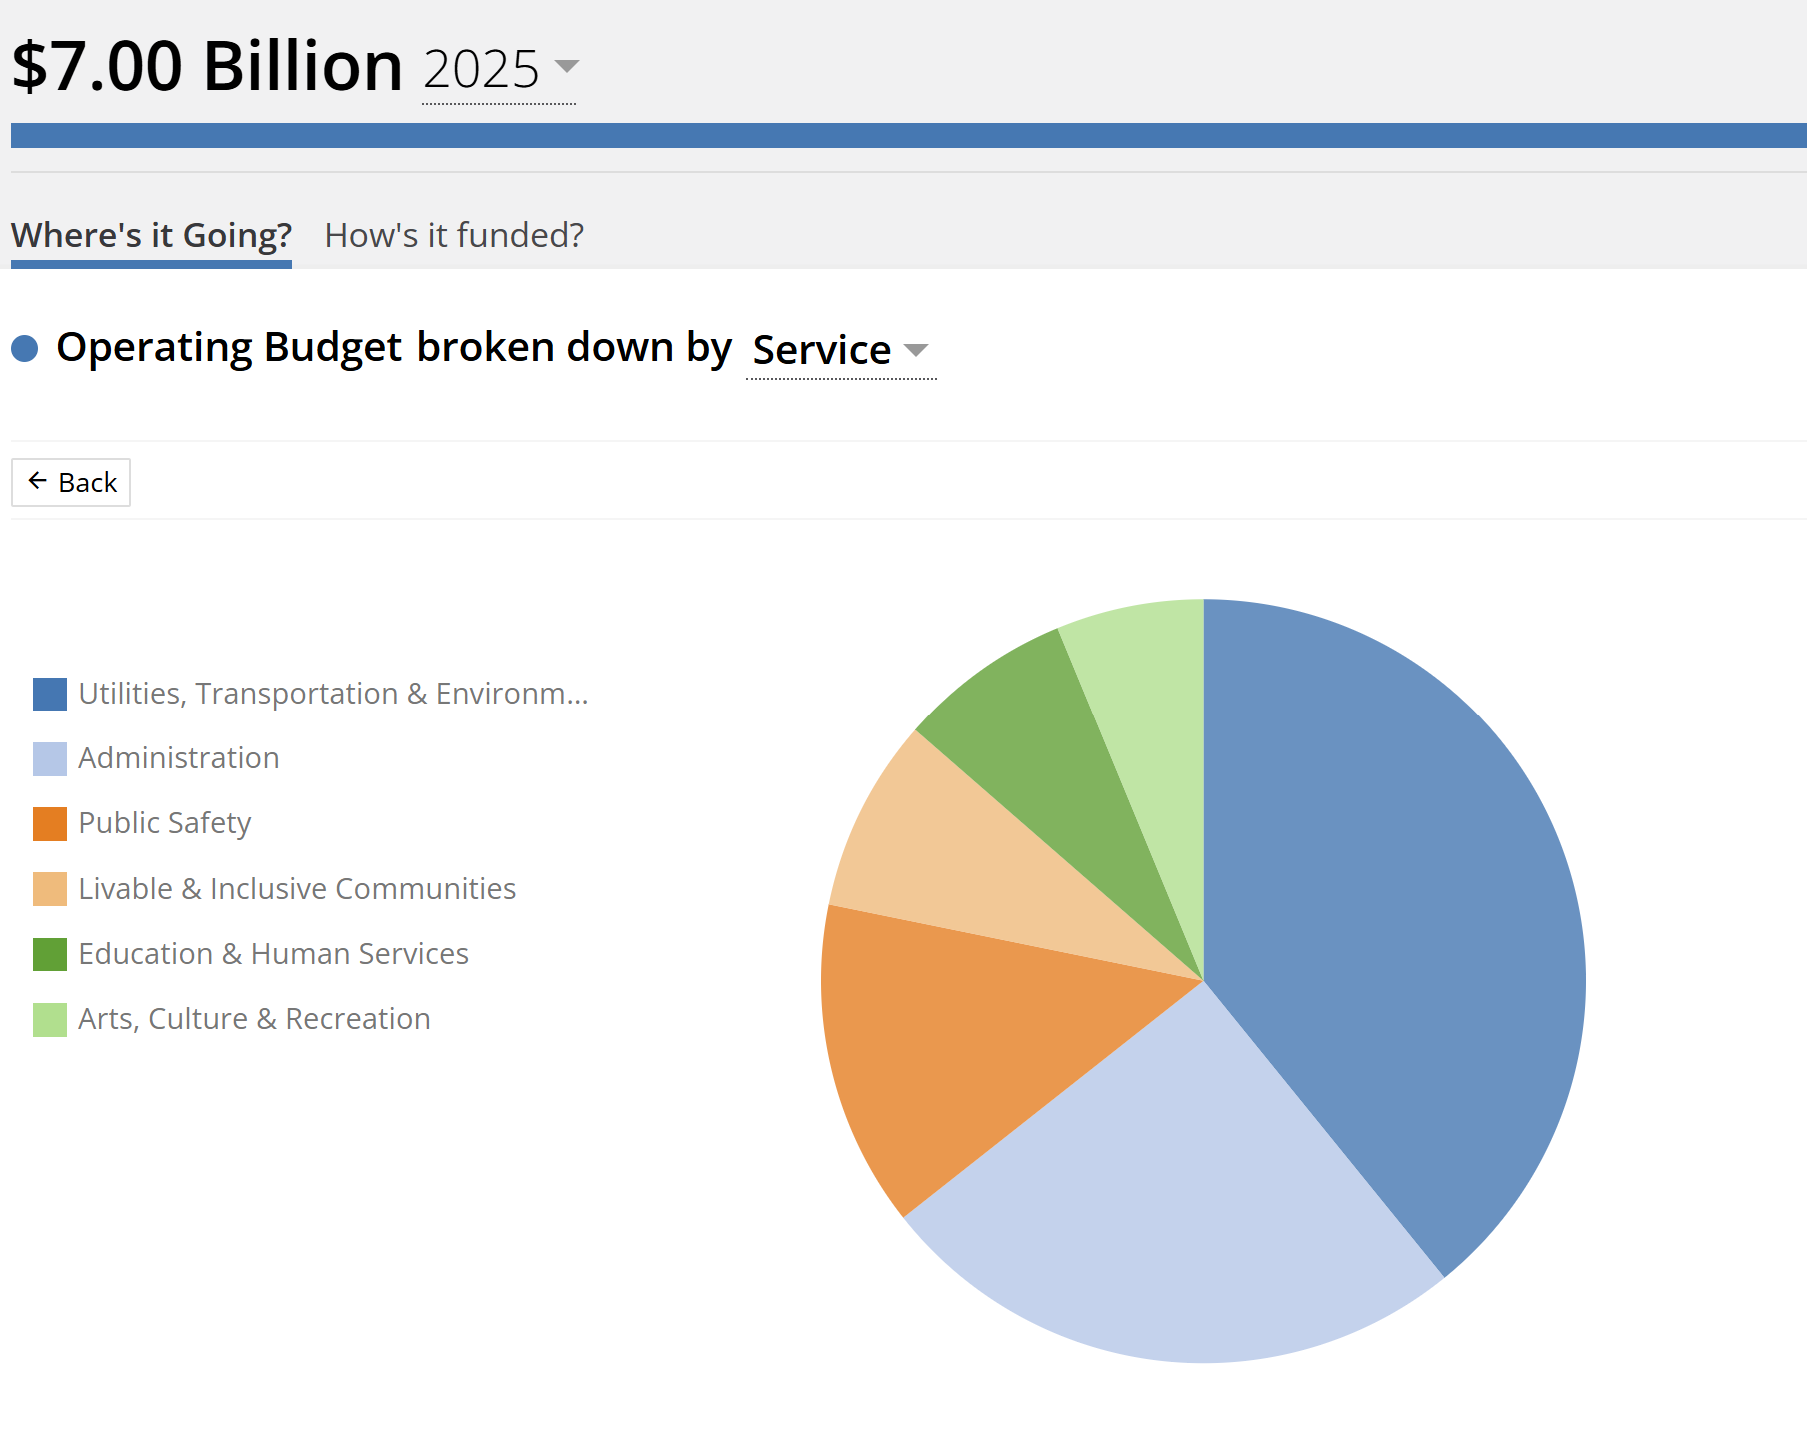
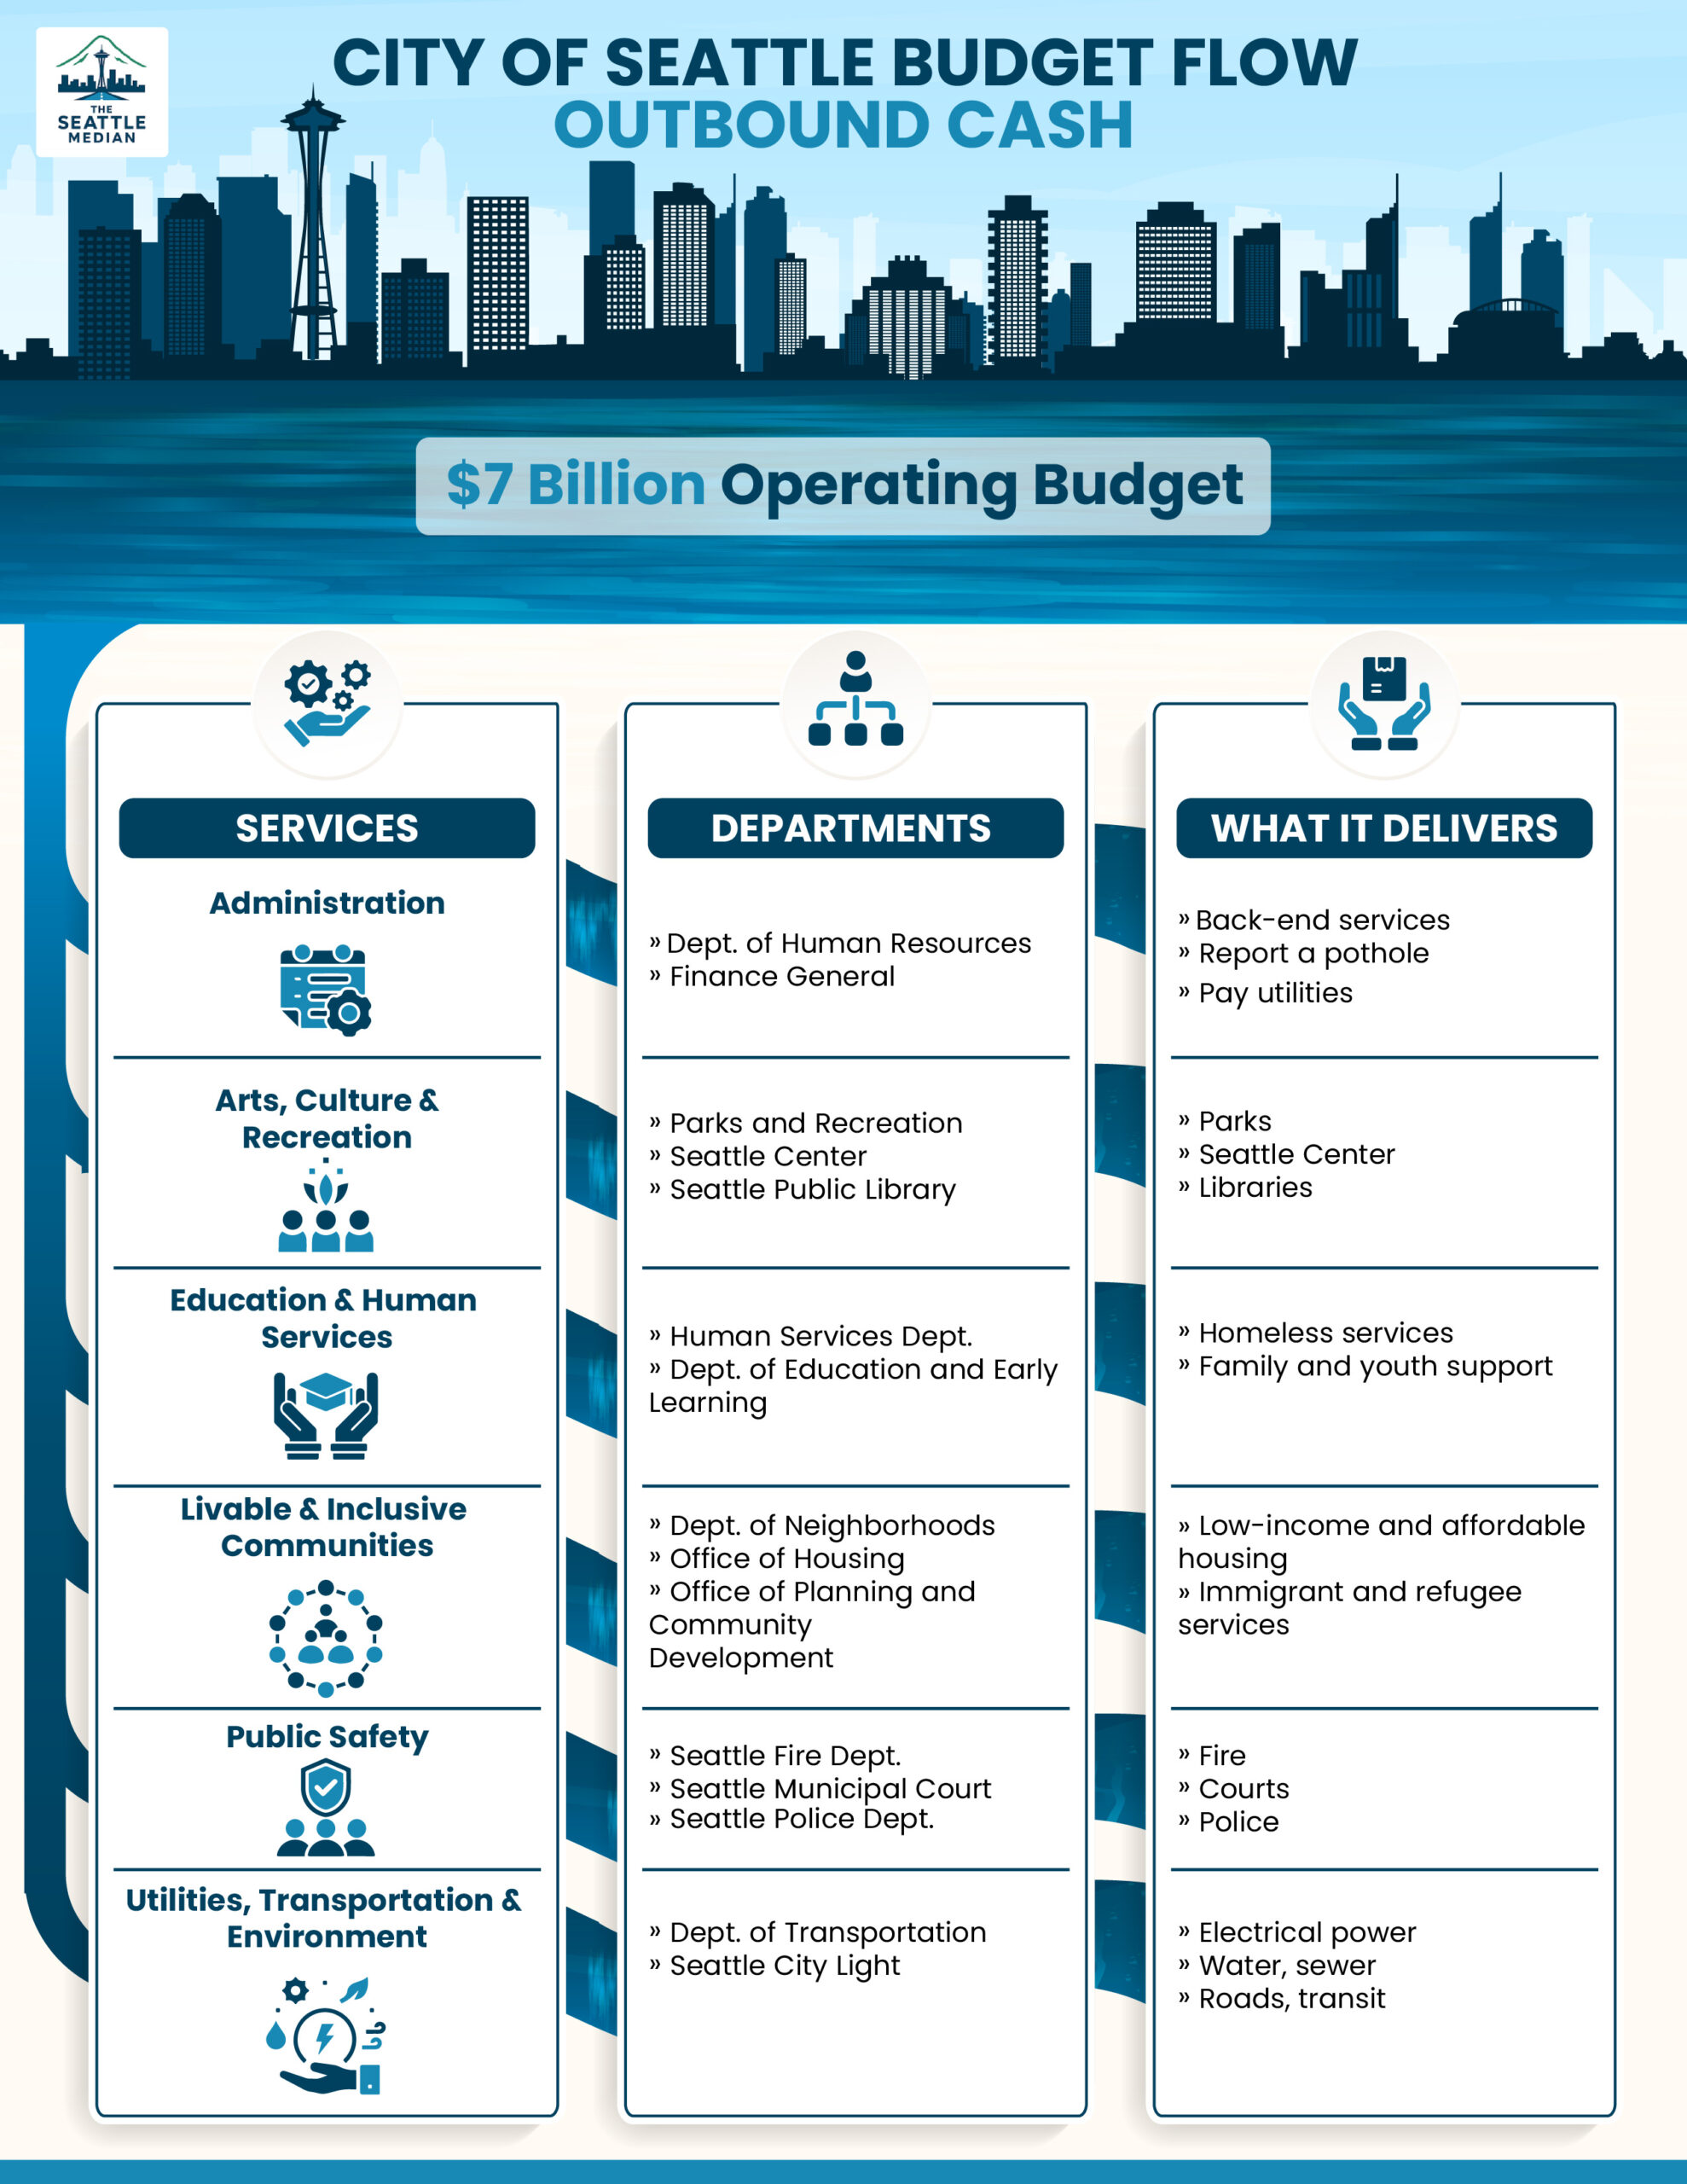
Where the Cash Goes: Service Areas
The Budget Office breaks the operating budget into six major policy buckets and tracks their growth over time, with the City’s 44 departments grouped within one of these policy areas. They are:
- Administration ($1.41 billion): Human Resources, Finance & Administrative Services, IT and more
- Arts, Culture & Recreation ($371.86 million) Parks & Recreation, Library, Seattle Center, Arts and Culture and more
- Education & Human Services ($449.30 million) Human Services, Education and Early Learning and more
- Livable & Inclusive Communities ($470.22 million) Housing, Construction and Inspections, Planning and Community Development and more
- Public Safety ($805.39 million) Police Department, Fire Department, Municipal Court and more
- Utilities, Transportation, & Environment ($2.42 billion) Public Utilities, City Light, Transportation, Sustainability and Environment and more
You can see a full list of departments by policy area in the table of contents of this City Council report.
Where the Cash Goes: Department
Open Budget’s breakout by department shows each City department’s budget and its percentage of the operating budget (these can also be tracked year-over-year back to 2018).
City Light, for example, owns largest single share of the operating budget pie, at 17.46%. Seattle Public Utilities is second largest, at 16.5%. This is why the Utilities, Transportation & Environment policy area represents nearly 40% of the operating budget.
The funding for each department varies. City Light is self-funded, receiving 100% of its funding from the Light Fund, with revenues entirely generated from residential, commercial, and industrial electric power sales.
The Seattle Police Department receives all (99.2%) of its funding from the General Fund. Same with the Fire Department.
Parks & Recreation is an example of a department with multiple funding sources, with half of its funding coming from the General Fund and the remainder coming from 6 other funds, including the voter-approved Park District Levy. Clicking on the Park District Levy allows you to see the programs funded this specific revenue source.
What the Cash is Paying for: Programs
Which brings us to programs. Every department provides of view a how each departmental budget is allocated by program. For example, you can see that the Office of Housing spends nearly 73% of its $343.43 million budget on multifamily lending.
From here, you may want to drill down into how a particular program is funded. Funding for the multifamily lending program, for example, is split between the Low Income Housing Fund (two-thirds of the program) and the Payroll Expense Tax (one-third of the program).
A click on the entire operating budget by program shows appropriations by program, from largest to smallest:
- The single largest appropriation by program is Debt Service, at $514.3 million – 7.3% of the operating budget.
- Appropriation to Special Funds is the next item, which represents fund transfers.
- Departmental Indirect Costs – overhead costs, in other words – accounts for $489.8 million, or 7% of the budget.
- Health Care for City employees costs $362.4 million, or 5.2% of the budget.
- Citywide Indirect Costs – more overhead – accounts for $279.7 million, or 4% of the budget.
You have to go eight lines down the largest expenditures in the operating budget before you reach an expenditure that does not directly fund the infrastructure of City government and is instead a program that Seattleites can access; this is the multifamily lending program, at $248.9 million.
General Fund
The General Fund is unique in that it is fed by a variety of revenue sources and is also spent on a range of programs. We reviewed where General Fund revenues come from in the first post. Now let’s look at how they’re spent.
Breaking it out by service, about half of the General Fund is spent on Public Safety, and more than 20% is spent on Administration.
Breaking it out by department, approximately three quarters of the General Fund is allocated to
- Seattle Police Department,
- Seattle Fire Department,
- Human Services Department,
- Finance General,
- Parks & Recreation.
Breaking it out by program, about one-quarter of the General Fund in spent on:
In our next post, we examine how and why the budget has grown in recent years.